Explore school enrollment trends with updated Big Local News data
Big Local News has added new data to its Stanford School Enrollment Project. Reporters and researchers can now access school year 2021-22 data for 27 states.
This includes detailed enrollment counts by grade at the district and school level. When available, data is also broken down by race, ethnicity, and gender, as well as counts of homeless students, English Language Learners, students with disabilities, and low-income students.
Using this data set, reporters can explore how Covid-19 impacted enrollment at public schools in their local districts, state or region. At a minimum, the data set includes enrollment over the past three school years, which allows pre- and post-pandemic analysis. In some states the data set goes back further and provides more historical context.
If you’re new to data journalism, Big Local News has created a tipsheet to get you started. This walks you through how to download a state data file and begin analyzing enrollment trends using Excel pivot tables.
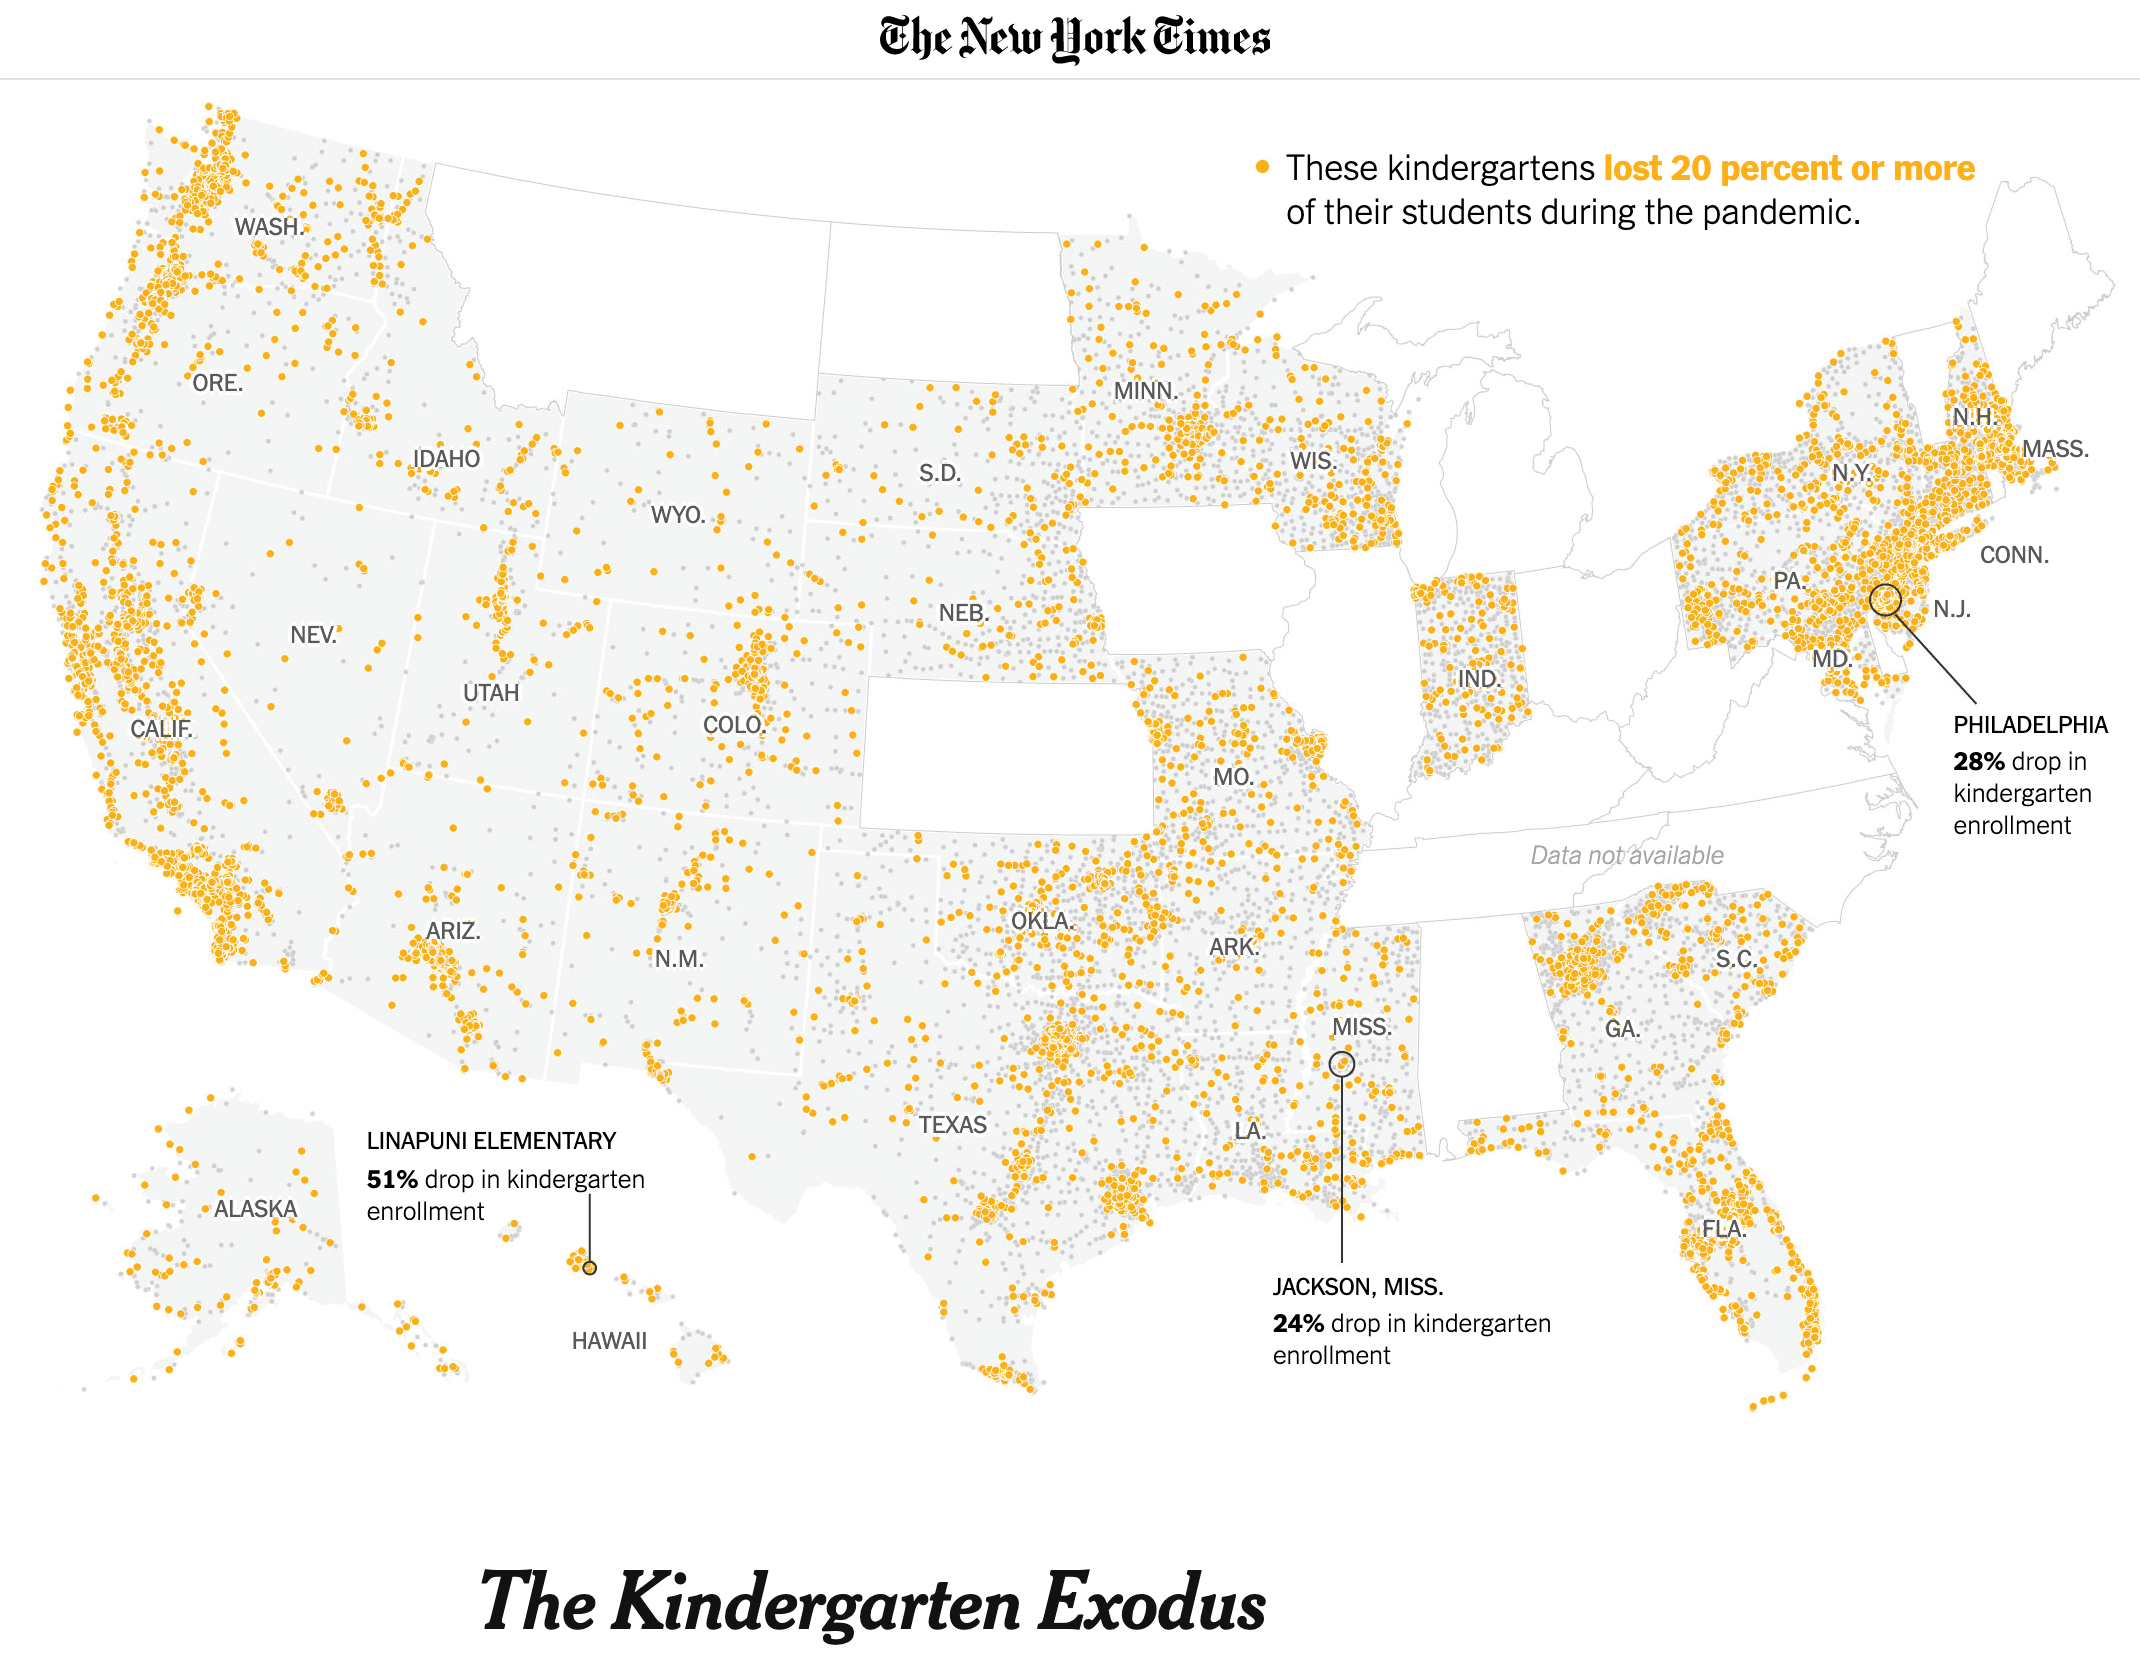
In partnership with Big Local News, The New York Times and Ed Source, a California nonprofit educational news site, analyzed enrollment trends at 70,000 schools around the country. Their reporting showed how going remote led to a dramatic drop in public school enrollment and an exodus of kindergarten students in the fall of 2020.
Researchers with Stanford University’s Graduate School of Education also collaborated with Big Local News. Their research paper found that school districts which offered remote-only instruction had significantly larger enrollment declines than those that offered face-to-face schooling.
If you have questions about the enrollment data or would like help analyzing it, please reach out to [email protected].


