How to explore individual campaign contributions using the FEC data
The elections are here and you may be working on a report on individual contributions using FEC data, but you might have noticed that the processed FEC data does not include the last few months of receipts. Don’t worry, here’s how to use the RAW dataset – also available on the FEC website – for your data analysis.
This data can be the source of local reporting such as Emily Bader’s piece in The Maine Monitor, check out her story here.
1. Download the data from the FEC - Processed & Raw Files:
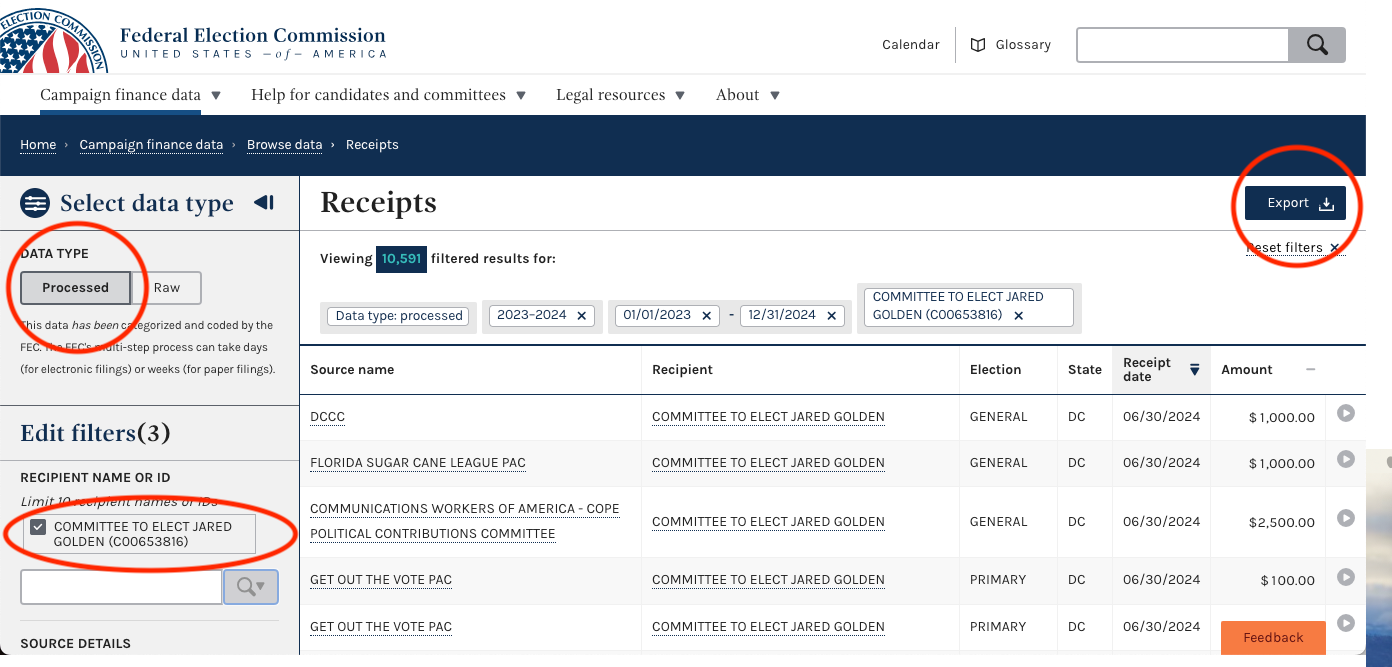
- Go to https://www.fec.gov/data/ → Raising → Browse receipts
- Edit the filters using the field “Recipient name or ID”, type in the name of the candidate that you want to explore. For example: Jared Golden.
- Double check that the data type is categorized as “PROCESSED” and export the file clicking on the “Export” button.
- Now, let’s download the “RAW” file as well. Click on Raw and then on the “Export” button again.
Note:
- The “PROCESSED” data has been categorized and coded by the FEC. The FEC’s multi-step process can take days (for electronic filings) or weeks (for paper filings). Double-check the date of the latest receipts processed looking at the receipt date, you should reference this date in your story.
- The “RAW” data has not yet been categorized and coded by the FEC. It’s pulled directly from a committee’s raw, electronic reports. It doesn’t include paper filings. So, in order to work with the “RAW” data, you need to follow some additional steps to filter it (we will explain below).
2. Filtering the datasets:
This analysis focuses on individual contributions. Since the database contains other types of contributions (PACs, Political Parties, etc.), it is necessary to apply several filters to isolate the records we need. These filters are a bit different when we work with the PROCESSED file and when we work with the RAW file.
2.1. Filtering each dataset to isolate individual contributions:
A. Filters to apply to the PROCESSED data:
- line_number: 11AI, 12
- entity_type: IND, ORG
- is_individual: t
B. Filters to apply to the RAW data:
- line_number: 11AI, 12
-
entity_type: IND, ORG
- You will notice that there is not an “is_individual” field in this dataset, so we need a couple of extra steps:
- Remove any additional memo entries that appear on Line 11(a)(i). These are denoted with an “X” in the memo_code column. Memo entries are used to disclose information but are not added to the overall schedule.
- Filter the contribution_receipt_date column: our PROCESSED dataset contains contributions until Jun 30, 2024, so you only need the records after that date. You will want to check the dates for the processed dataset you are using.
2.2. The best way to apply these filters and analyze our data is through a PivotTable.
Let’s use it to check our total individual contributions.
- First, you are going to work with the PROCESSED file.
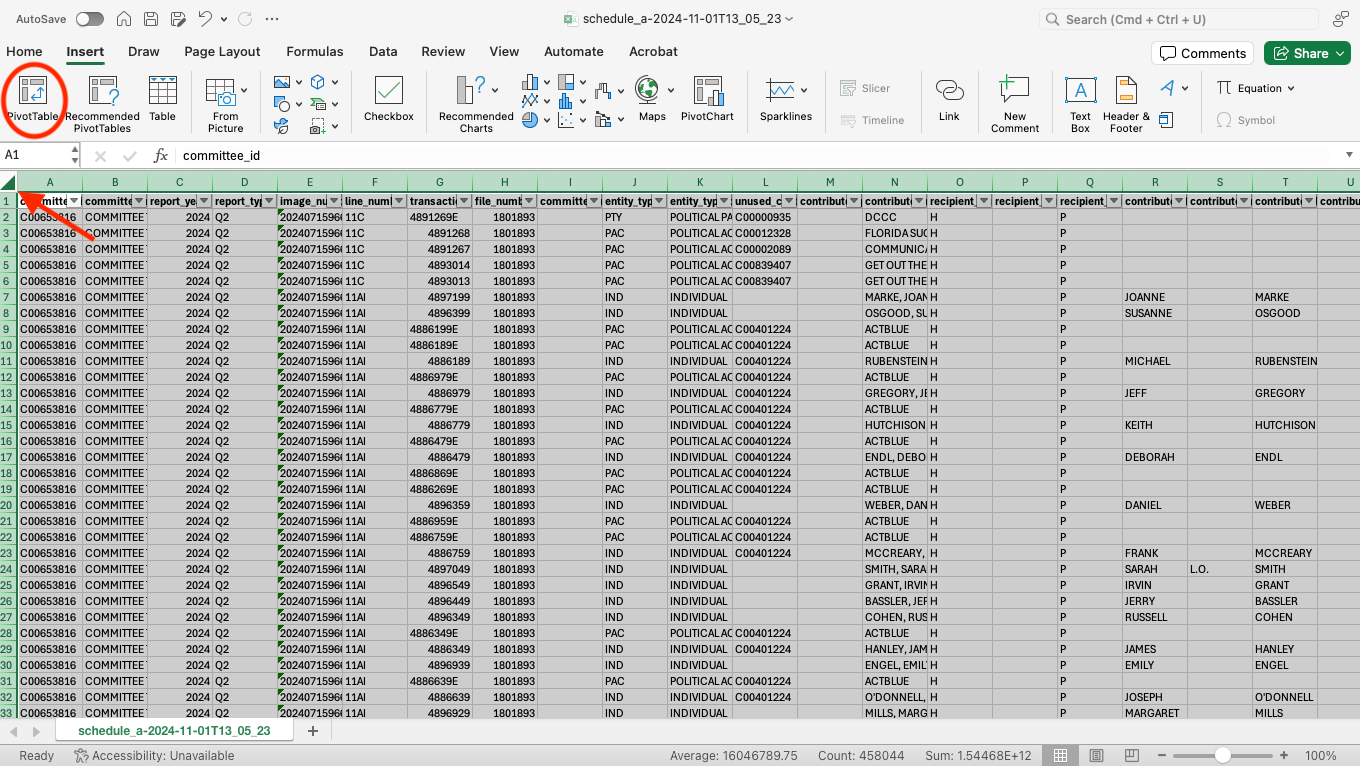
- Go to the left corner of your table and click on it, that will help you to select all the data.
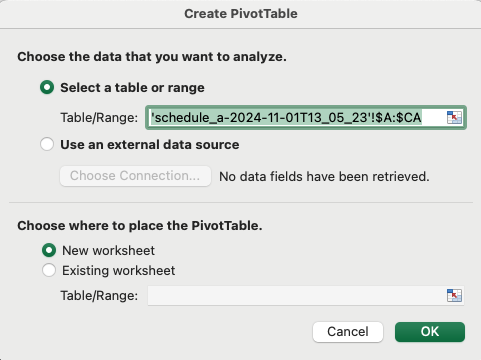
- Then click on “Insert” and click on “PivotTable”, choose to use a “New worksheet”.
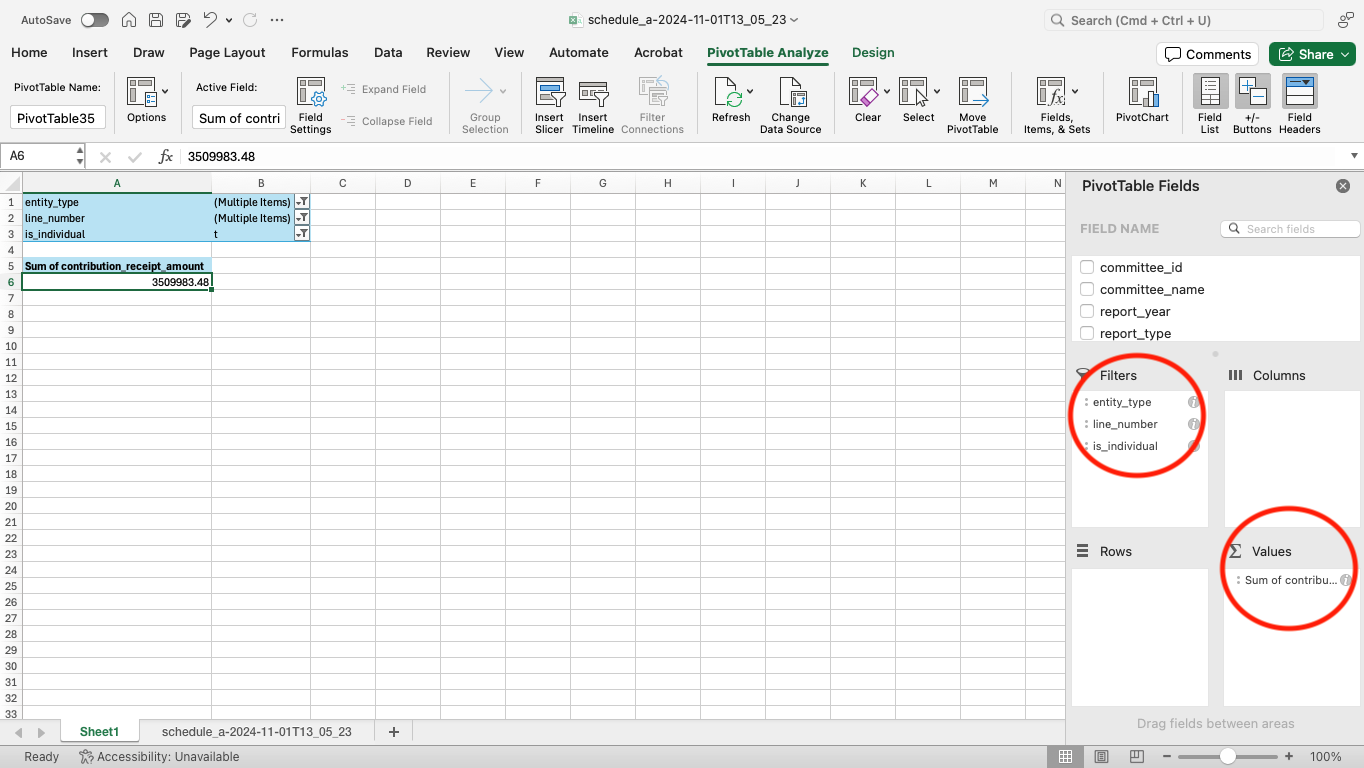
- Choose the following fields as your Filters and select the following values:
- entity_type: IND, ORG
- line_number: 11AI, 12
- is_individual: t
Those filters will limit our analysis to individual contributions only.
- Choose the contribution_receipt_amount as your Values. As the default option, the values are going to be summed up.
- As you can see, the individual contributions total is: $3,509,983.48
- Let’s work now with the RAW file.
- Go to the top left corner of your table and click on it, that will help you to select all the data.
- Then click on “Insert” and click on “PivotTable”, choose to use a “New worksheet”.
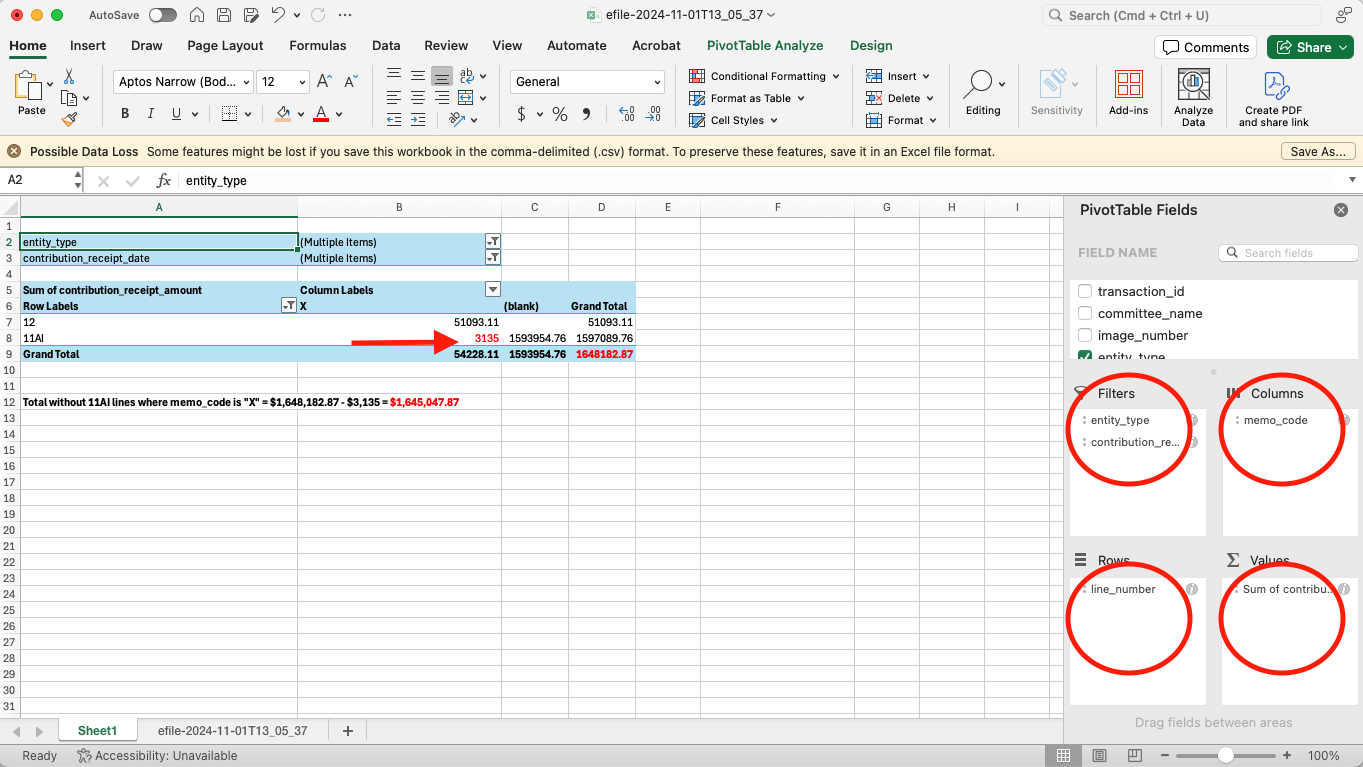
- Choose the following fields as your Filters and select the following values:
- entity_type: IND, ORG
- contribution_receipt_date: choose only the dates after June 30, 2024.
- Choose the column memo_code as your Columns.
- Choose the column line_number as your Rows.
- Choose the contribution_receipt_amount as your Values. Again, as the default option, the values are going to be summed up.
As you can see, your Grand Total is $1,648,182.87. However this number includes the line_number “11AI” where memo_code is “X”. We need to exclude those records, as we mentioned earlier: memo entries are used to disclose information but are not added to the overall schedule.
- Let’s click on any empty cell and make your calculations: Grand Total - 11AI lines where memo_code is “X”, in our case the numbers are the following: $1,648,182.87 - $3,135 = $1,645,047.87 This is the total of individual contributions from the RAW dataset.
- Now, in order to calculate the total of individual contributions in the full cycle, you have to sum up the total you got from the PROCESSED file and the one from the RAW. In our case: $3,509,983.48 + $1,645,047.87 = $5,155,031.35
You can fact-check this number by reviewing the FEC Financial Summary linked to your candidate, in our case Jared Golden. You should take into account the “Itemized individual contributions” as well as the “Transfers from other authorized committees”:
- Note from the FEC: The “Transfers from other authorized committees” contain mostly individual contributions that were made through joint fundraising committees, so that should be part of your overall sum of individual contributions. You should include these transactions.
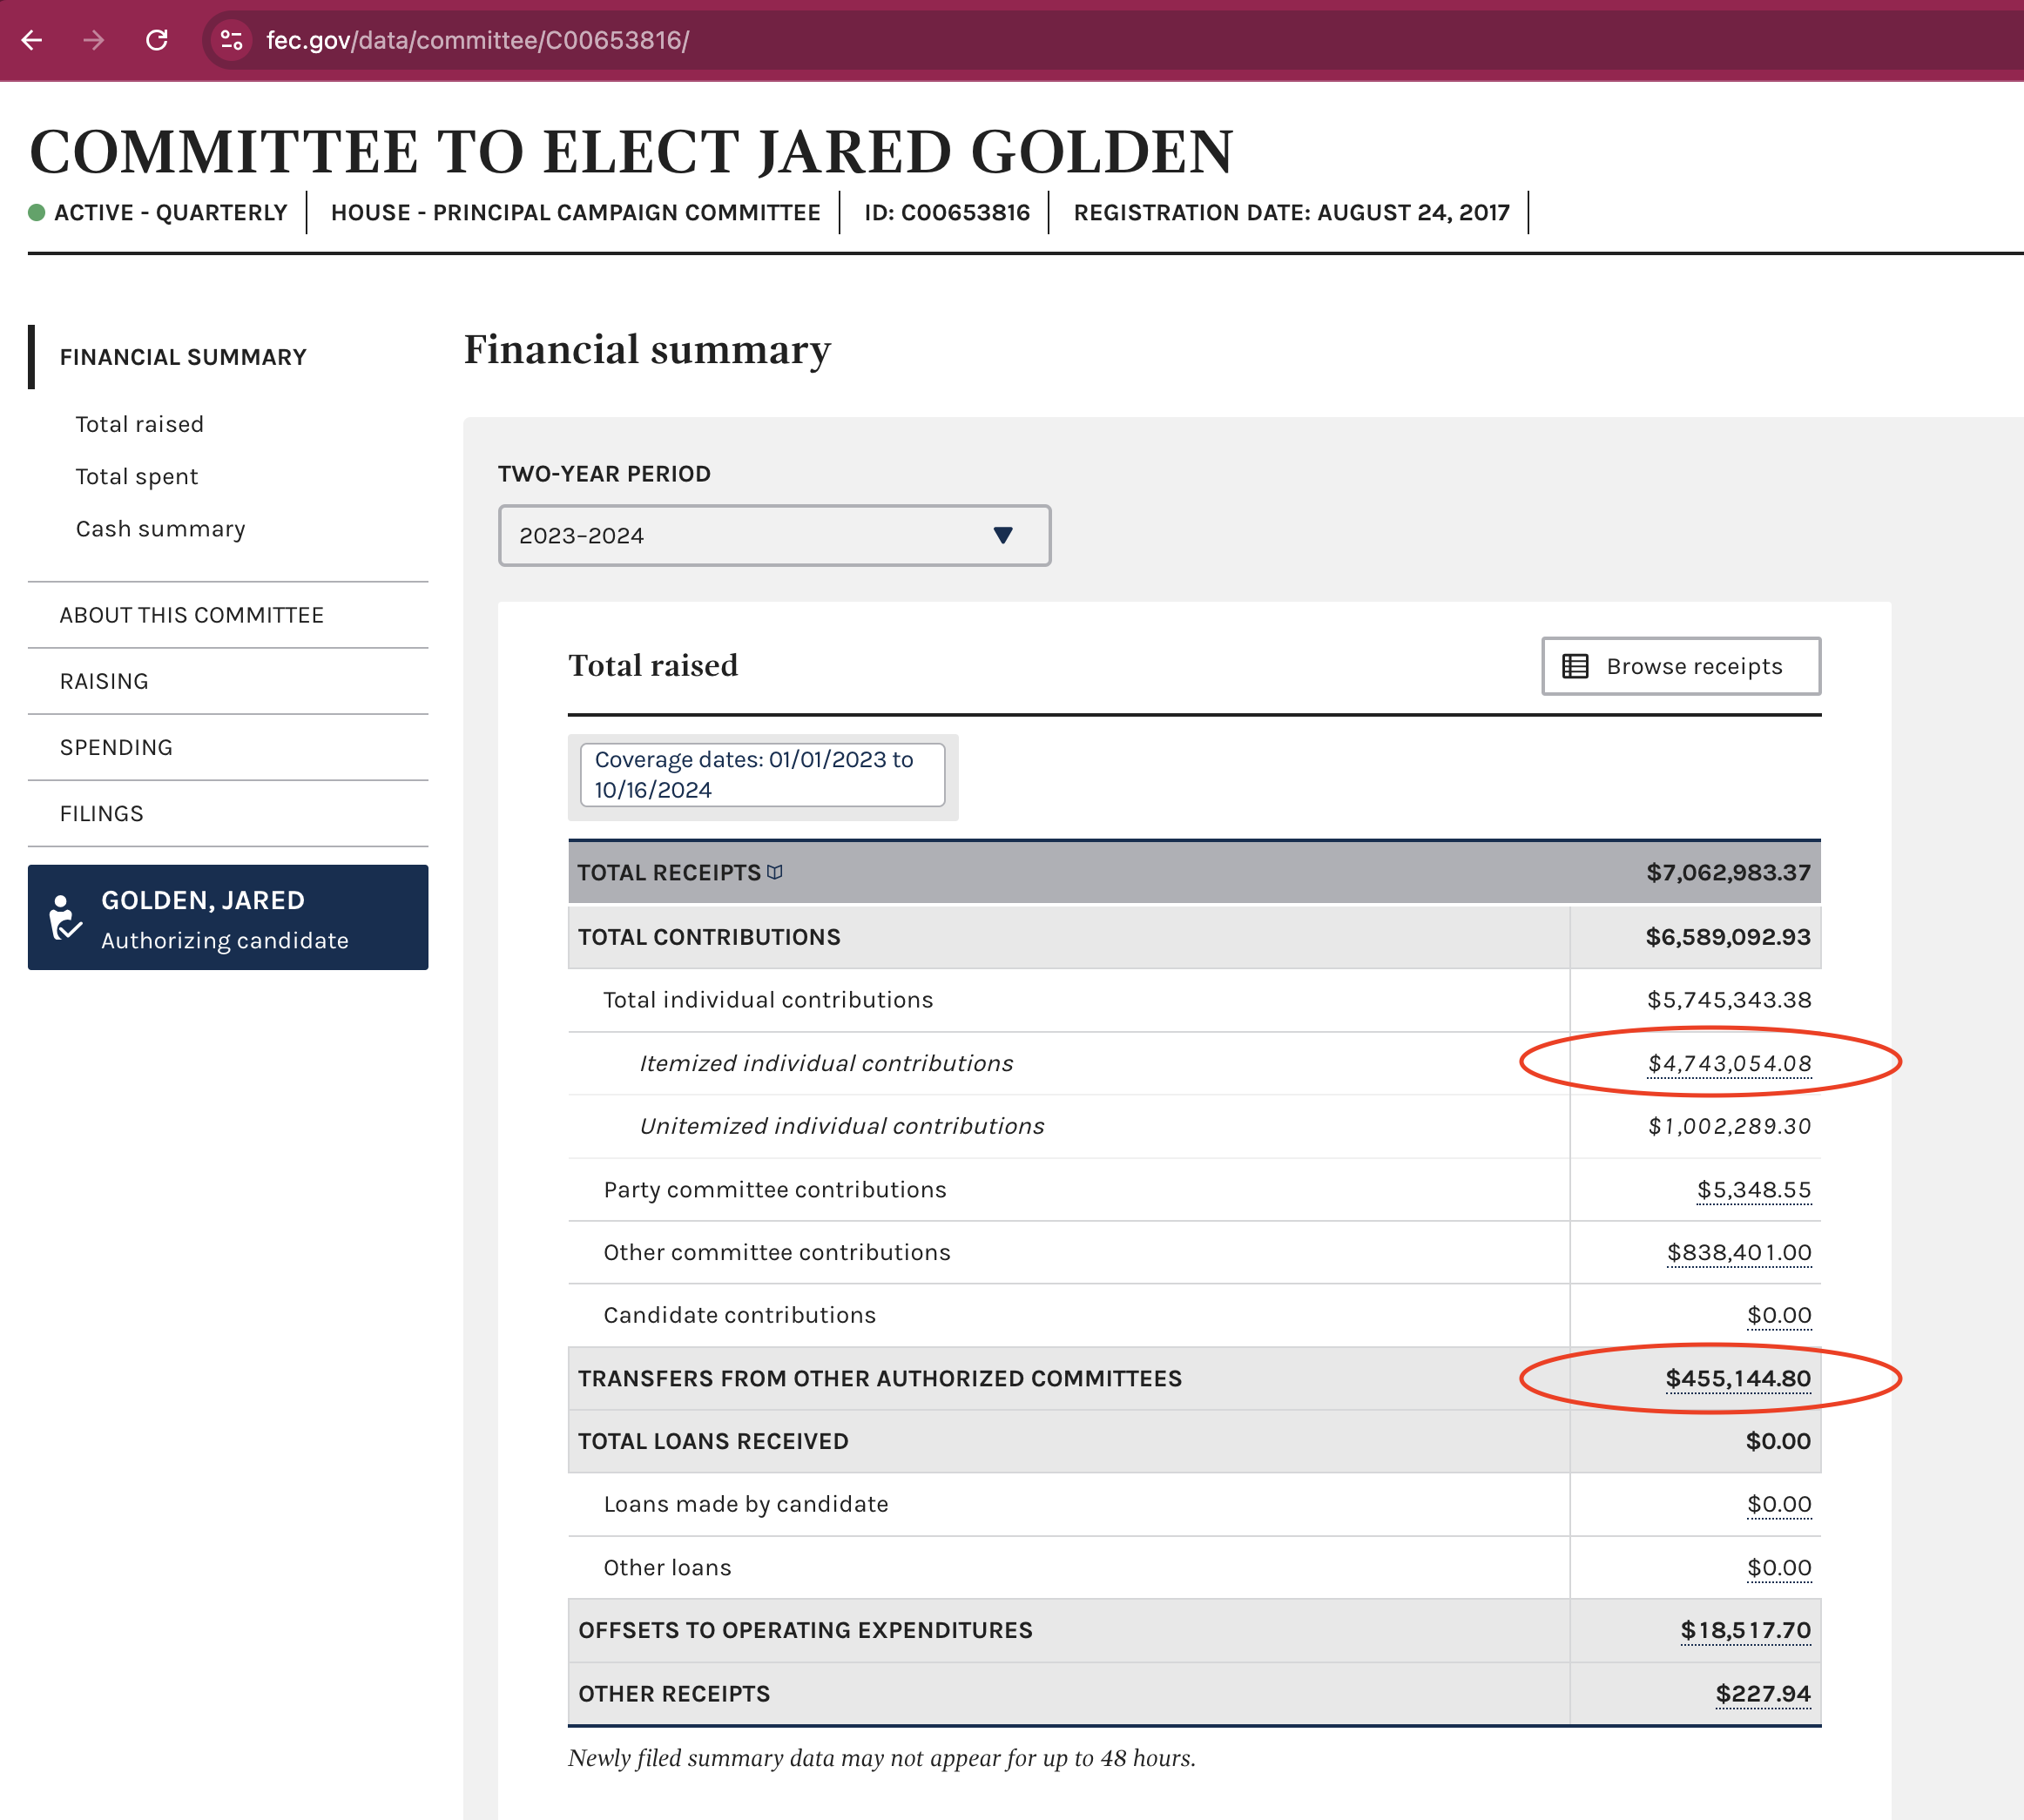
- Then, the FEC total for individual contributions to Jared Golden is: $5,198,198.88
- As you have noticed, the numbers are pretty close, but they do not match exactly.
- OUR TOTAL: $5,155,031.35
- FEC TOTAL: $5,198,198.88
- DIFFERENCE: -$43,167.53
Here is why, according to the FEC: “the numbers on the joint fundraising transfers will not add up exactly because the totals are net amounts (the overhead/fundraising expenses would have been deducted by the JFC prior to transferring the proceeds to the participating committees), whereas the memo entries are the gross amounts.” Please, take this into consideration when you are fact-checking the numbers, at least your two first digits should match the FEC totals.
The steps that we have followed for calculating the total individual contributions for each dataset also apply to other calculations, such as determining how much of the individual contributions come from in-state vs. out-of-state, identifying the main individual contributors, and so on. To answer any of these questions, you’ll need to filter each dataset as described above, calculate the totals for each one, and then add them up!
About Big Local News
From its base at Stanford University, Big Local News gathers data, builds tools and collaborates with reporters to produce journalism that makes an impact. Its website at biglocalnews.org offers a free archiving service for journalists to store and share data.
Learn more by visiting our About page.


