How you can use the Brain Waste project data to cover labor disparities in Europe
Europe’s spiraling anxiety over migration is roiling its politics, dominating elections and undermining human rights. People on the move are presented as a drain on the bloc’s resources and a threat to European culture, boosting the profile of nativists and populists, and, as could be seen in the recent European election, bringing the far right closer to power. But away from the polarized politics the richest bloc of countries in the world is aging fast and its economies have critical skills shortages that migrants play a key role in filling, potentially preventing imminent economic decline.
Despite pressing economic needs, EU countries are making it hard for non-natives with college degrees to work in fields they are qualified for. Many find it challenging to find any gainful employment at all. What is the scale and cost of this neglected migrant talent, known as brain waste? Who is most affected by it? What are its causes? And where are the biggest opportunities to resolve Europe’s skills’ shortages and support migrants to fulfill their economic potential?
To answer these questions, Lighthouse Reports together with the FT and El Pais, has spent more than six months analyzing the European Labor Force Survey. In a first for a journalistic investigation, we gained direct access to the sensitive microdata of more than 1 million Europeans annually. Informed by social science, we made extensive use of regression analysis and statistical modeling to gauge the scale, causes, and consequences of brain waste. For more details on our approach, check out our Methodology published on Lighthouse’s website.

Past reporting based on the data
Our analysis reveals that:
-
Across Europe, 47.5% of college-educated immigrants are over-qualified for their jobs compared to 32.9% of natives.
-
If immigrants earned the same wages as natives, the European economy could grow by 33.8 billion Euros, or 0.36% of GDP.
-
In most countries, women are more affected by brain waste than men.
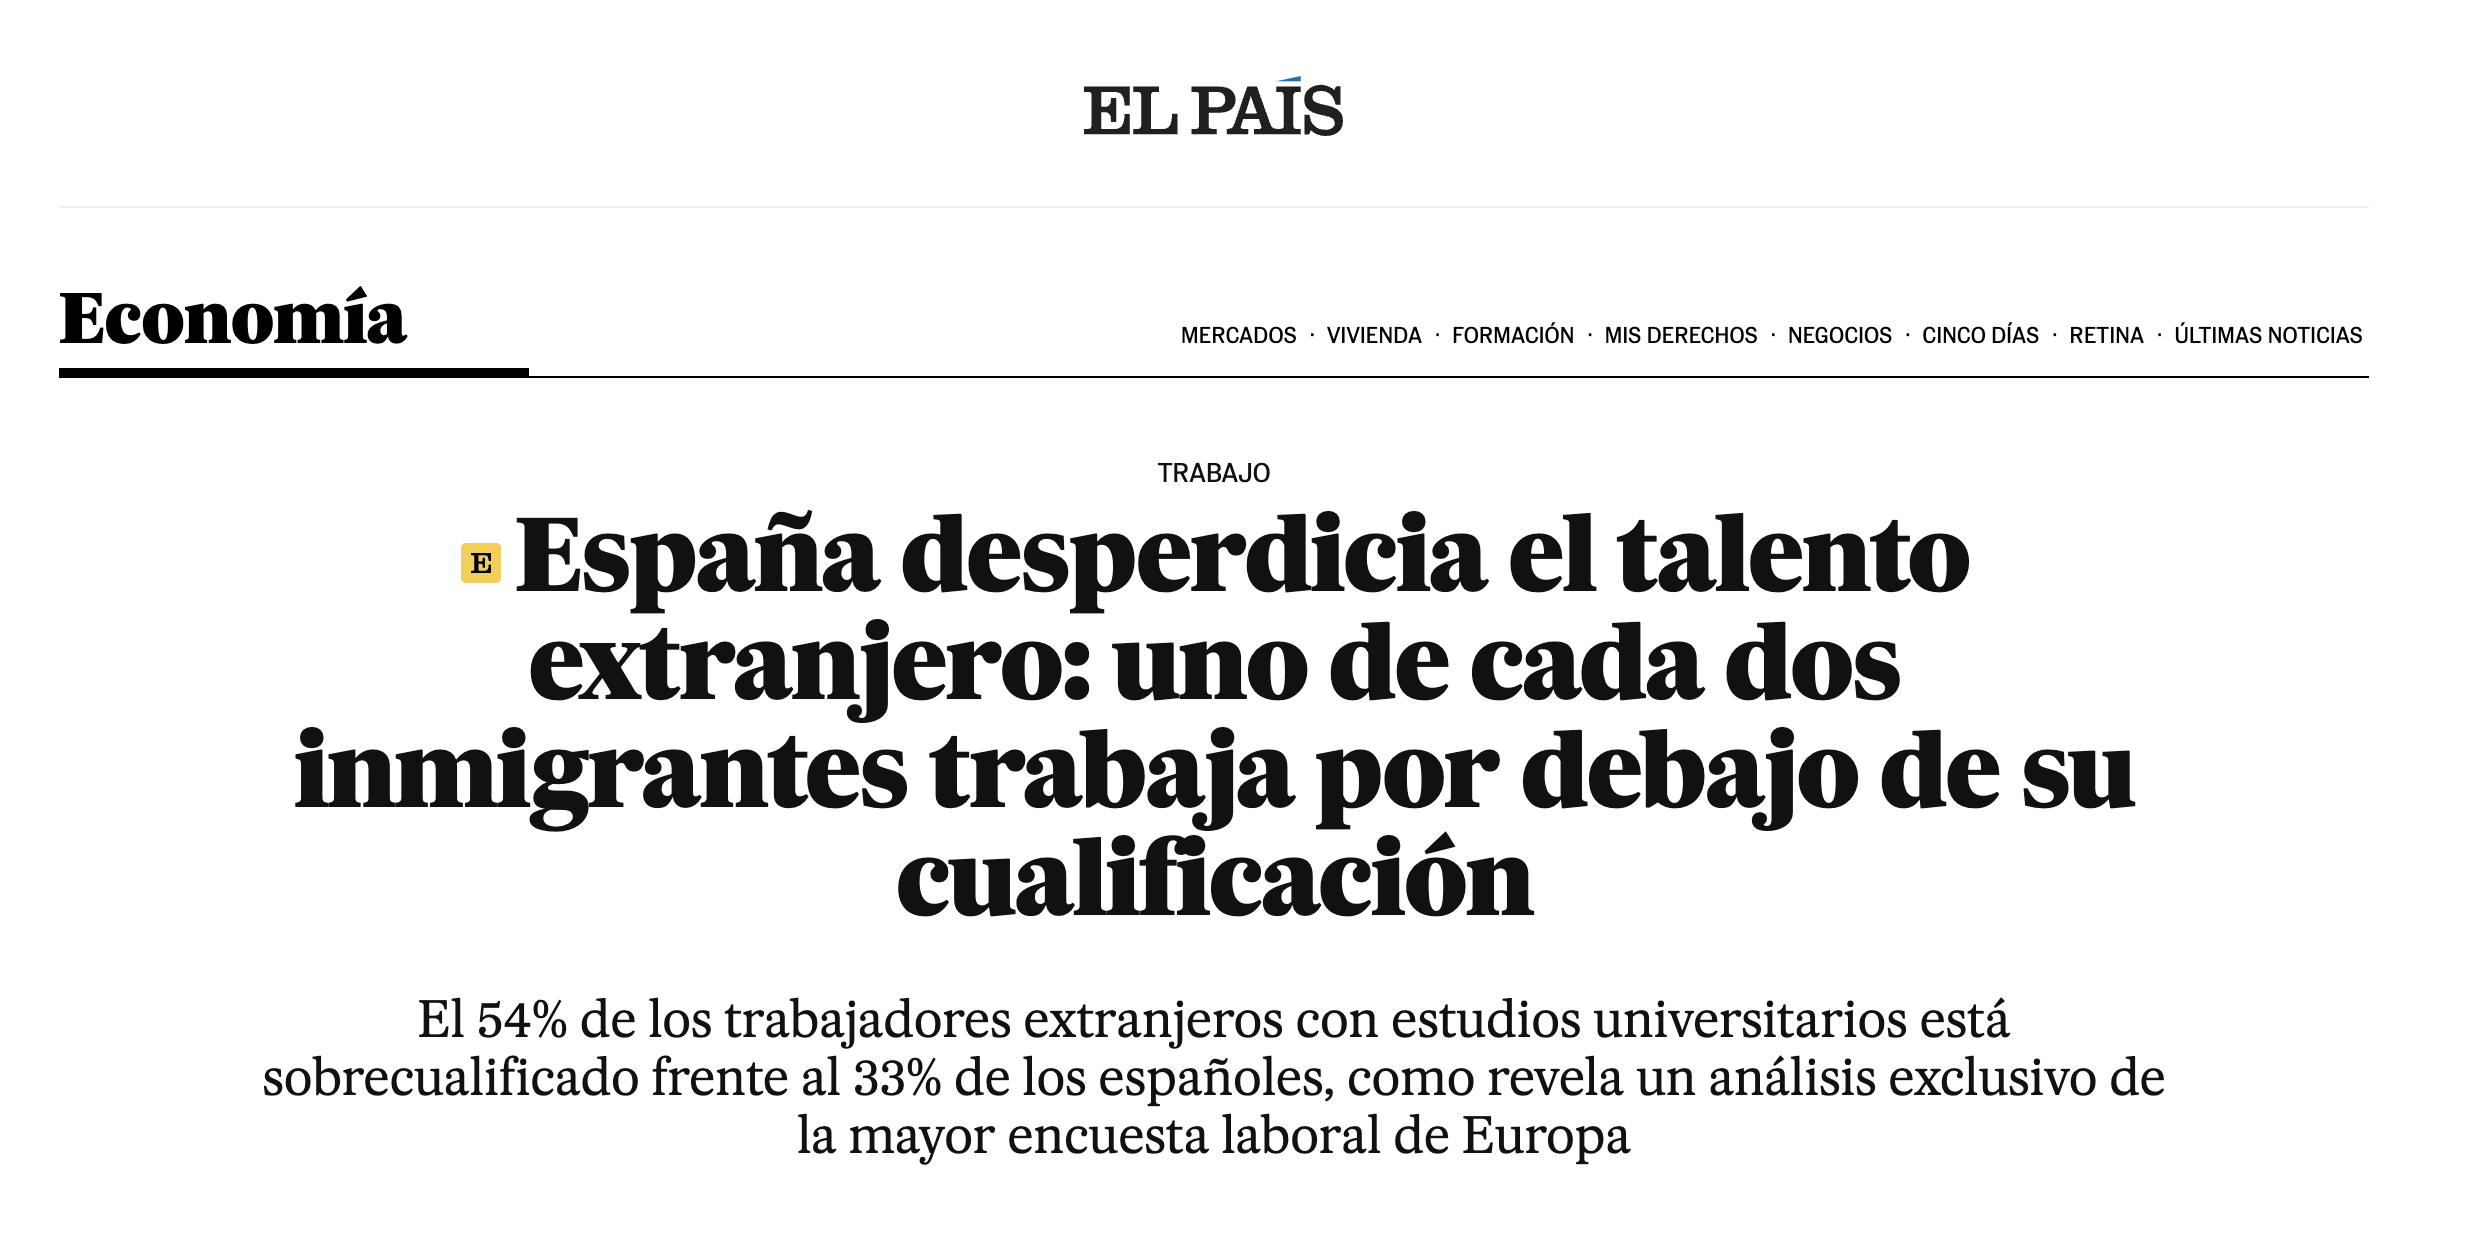
This data helped us not only measure the scale of brain waste across Europe and in particularly hard hit areas such as Spain, it helped us dig deep into the reasons and consequences. In Spain, an investigation reveals that the “success” of integrating migrant doctors into the workforce actually masks a more complex reality of a failed degree recognition program that forces specialists to either repeat their degrees or work as general practitioners officially and specialists unofficially, without the job security or benefits. A reporter who is a victim of brain waste himself, explains that in Sweden, despite widely touted integration programs, native language fluency, preference for local degrees and the difficulty of breaking into non-regulated professions have earned Sweden a spot as one of the countries where brain waste is most prevalent. Check out the full investigation here.
Making sense of the data
Across our tables, we use three distinct definitions of brain waste:
-
Over-qualification: Working in occupations below one’s skill level. A typical example of an over-qualified worker would be a doctor who works as an assistant nurse.
-
Under-employment: Not working as much as one wants to. For example, a part-time teacher is under-employed if they would like to and are able to work fulltime.
-
Unemployment: Not working despite wanting to have a job.
-
Natives: People born in the country.
-
Migrants: people born in one country and moved to another.
We measure brain waste in two different ways:
-
Raw difference: This is the literal gap between the employment outcomes of natives and the employment outcomes of migrants. But this means if the migration population looks different than the native population, it’s less clear what’s causing the gap. For example, if migrants are younger than the native population, they might be more likely to have fixed term contracts because they are younger, not because they are migrants, or because of both.
-
Controlled Difference: Regression analysis compares similar natives and immigrants. This ensures that the differences between natives and immigrants are actually caused by migration status and not some third factor such as gender or age.
Brain waste typically affects other labor market outcomes, too, which we also report in our tables.
-
High-skilled: working in highly skilled professions. People working in occupations labeled as managers, professionals, technicians, and associate professionals are considered highly skilled.
-
Mean income decile: The ELF only contains information about an individual’s monthly wage decile, i.e., what share of the population makes less than them. For example, a person who earns more than 35% of the population would be in the fourth decile.
-
Shortage occupation: An occupation with a lot of unfilled positions. An occupation is defined as a shortage occupation if it is included as a shortage occupation in this EURES report from 2022.
-
Regulated profession: An occupation that requires some form of license to perform. Migrants can seek to have their foreign credentials recognized, which is frequently touted as a solution to brain waste. But the process of actually obtaining recognition remains difficult or impossible in most places.
-
Fixed-term contracts: employment contract is limited in time and is not a permanent position with job protection guarantees.
Finding your story
- Step 1: Download the data
All the data is already summarized by country or subnational region, so you will need to do minimal analysis to uncover your story. You can download the data and the README file here.
- Step 2: What does brain waste look like in your community?
Filter the tables by the country or region you are covering to uncover the scale of brain waste and its locally distinctive patterns. It’s useful to compare your focus area with the rest of Europe: Are immigrants more likely to be relatively over-educated or are they more likely to be unemployed? How has brain waste changed over time?
Table 1 contains brain waste and labor market indicators for natives and migrants as well as the difference between the two on the country level.
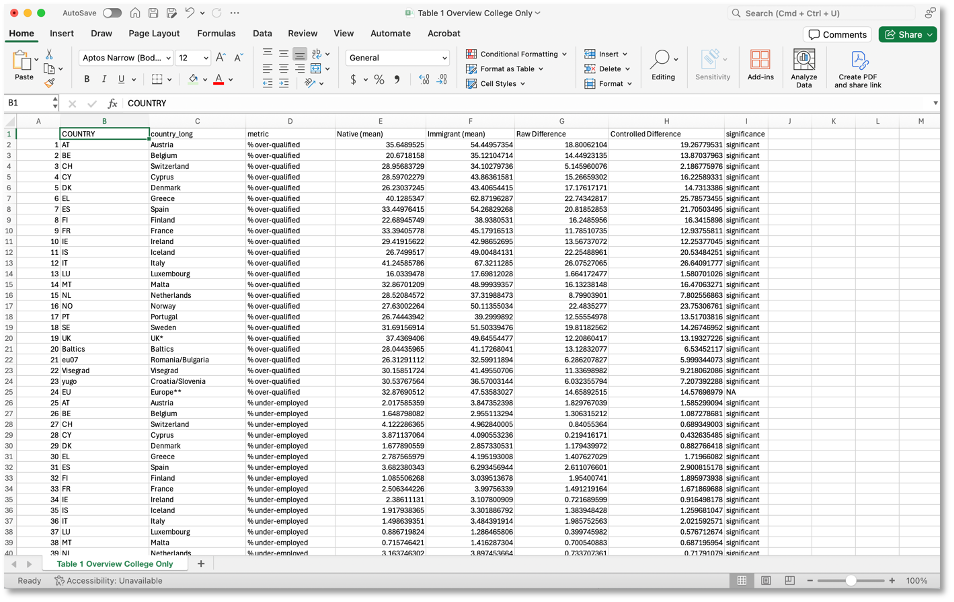
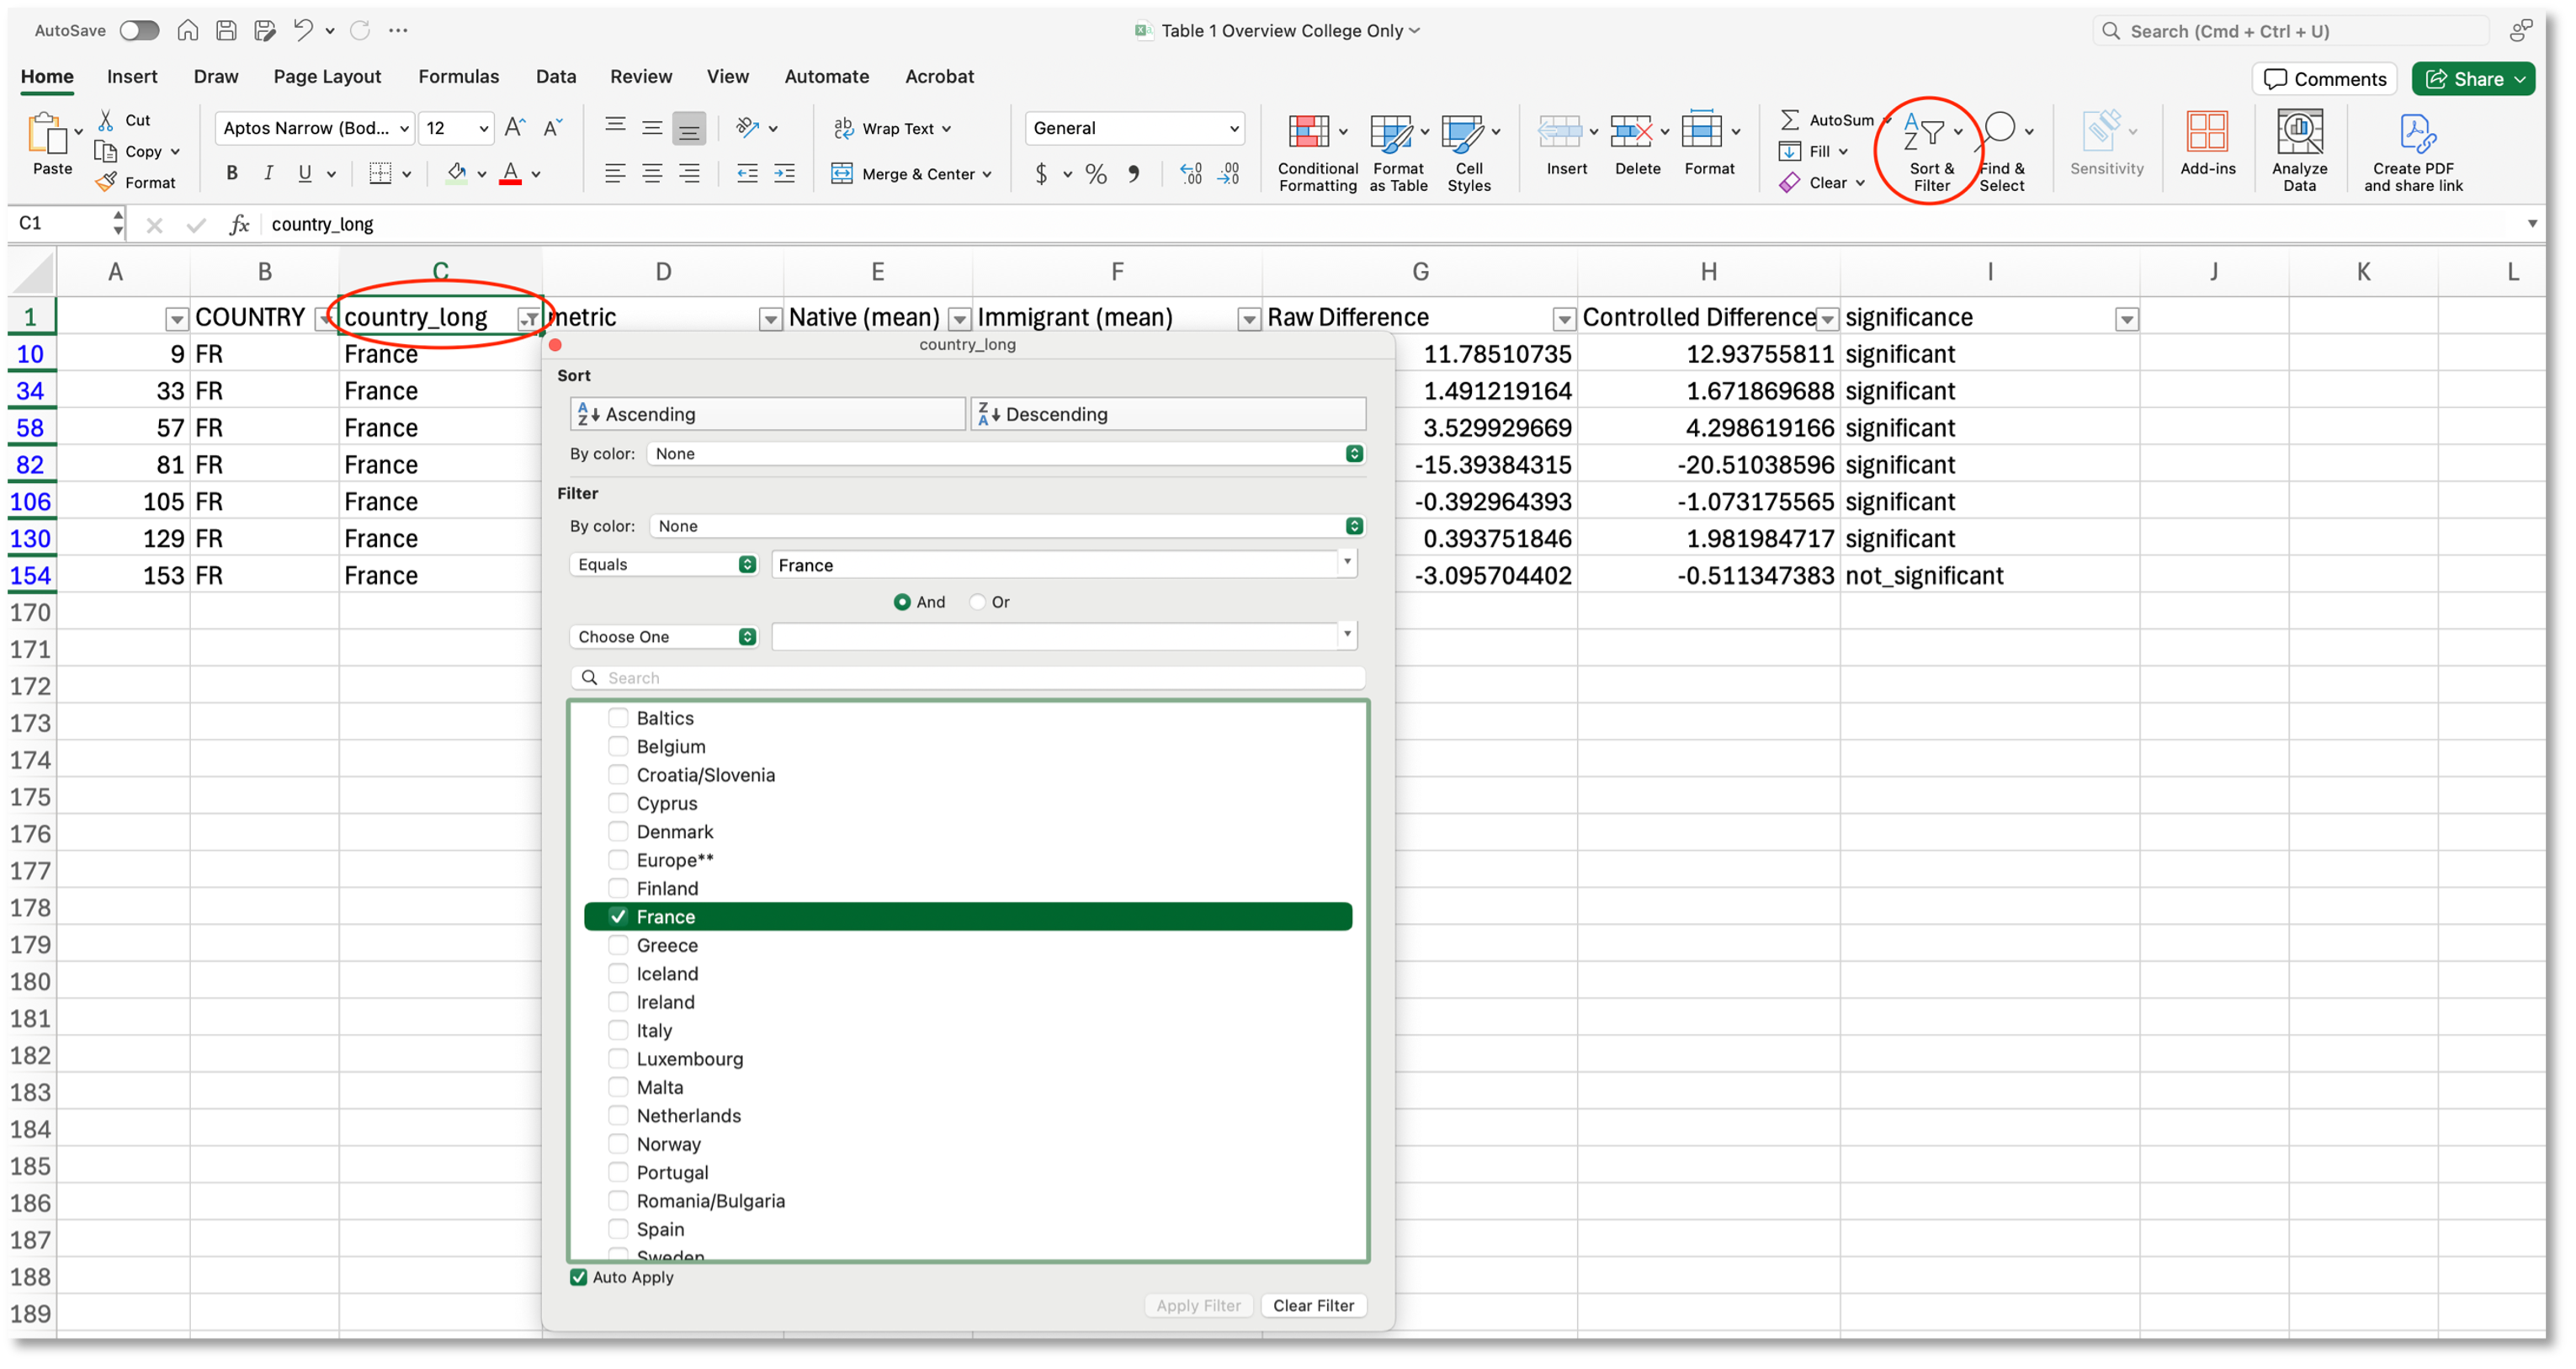
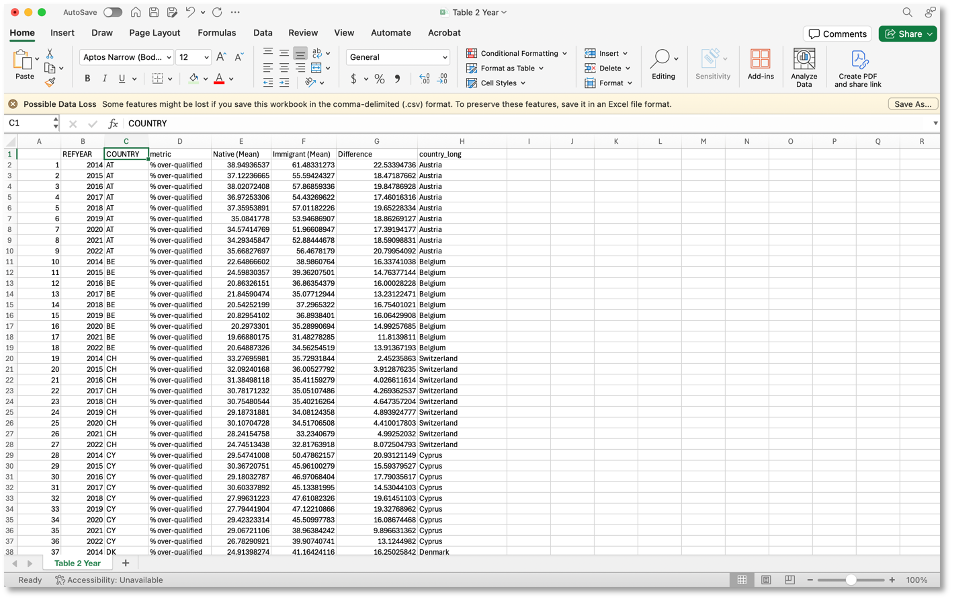
Table 2 contains yearly data on all main indicators going back as far as 2006 where available.
- Step 3: Who is most impacted by brain waste in your country?
Look for big gaps between people from different demographics. Are women more affected than men? What is the gap between migrants from the Global South versus Global North? What degree holders are most likely to suffer from brain waste compared to natives? Where do victims of brain waste end up working? As you go through the data, build up a ‘profile’ of immigrants who are particularly likely or particularly unlikely to suffer from brain waste. These are the people you want to talk to later on!
Tables 3, 4, 6, 7 and 8 can be used to dig into the groups most affected by brain waste along a number of dimensions: Global South/Global North country of origin (3), gender (4), field of education (6), occupation (7), and field of education and occupation (8).
- Step 4: What factors make brain waste better or worse in your country?
The factors that make migrants more or less likely to suffer from brain waste vary widely from country to country. This data can help pinpoint what may improve people’s chances of finding a job in their profession. Are migrants who are fluent in the local language significantly less likely to suffer from brain waste? Are migrants who took language courses less likely to suffer from brain waste? Are migrants who earned their degrees locally or in their home country more likely to suffer from brain waste? Are migrants who got their foreign degree recognized less likely to suffer from brain waste? How does the reason for migration influence brain waste?
Table 10 breaks down labor market outcomes by the place of education. Frequently, migrants find it easier to access employment opportunities if they received their degrees from host country institutions.
Tables 11 and 11a show labor market outcomes by language skills and whether immigrants have taken a language course, respectively (2021 data only).
Tables 12 and 13 give breakdowns by length of residence in the host country (more or less than 10 years) and reason for migration (2021 data only).
- Step 5: What is the monetary price being paid for brain waste?
The data on economic modeling allows reporting on how much income migrants are missing out on an individual level by not earning the same as natives and also on a national scale, how much revenue the country is missing out on by allowing brain waste to continue.
In Table 9, we estimate the economic costs of brain waste. The table is based on models estimating by how much economies would grow if immigrants were earning the same as comparable natives and the economic potential of reducing over-qualification and under-employment to native levels.
- Step 6: Ground Reporting
There are several very important questions about the root causes of brain waste that the data simply cannot answer. Interviews are key to filling the gaps in the story. Why does degree recognition for migrants not work as expected? What role does lack of anti-discrimination policies play in perpetuating brain waste? What is the role of labor unions in perpetuating brain waste? How do visa limitations contribute to brain waste?
With all the anti-migrant vitriol in Europe, another key ground reporting element is investing in in-depth reporting on the victims of brain waste to bring empathy into the equation and storytelling. The barriers and frustrations faced by those experiencing brain waste can ensure the audience feels invested in the issue in a way using the data alone may not achieve.
Data Description
We received the individual level Economic Labour Force Survey (ELFS) from Eurostat –the statistical office of the European Union– for all EU countries except Germany, plus Norway, Switzerland, Iceland and the United Kingdom (until 2019). The survey contains more than a hundred variables, covering respondents’ demographic background (age, gender, NUTS 2 region of residence etc.) as well as a host of labor market outcomes (employment, wages). All standard variables are contained in this codebook.
For 2008, 2014, and 2021, the ELF contains additional labor market variables specifically related to immigrants’ labor market performance, including their language skills in the host country language and whether immigrants sought and received recognition of their professional qualifications. These additional variables can be found here.
The great advantage of using the ELF is that it has been carried out using a broadly consistent methodology for all EU/European Economic Area (EEA) member states. This means we can compare how immigrants in one country are faring compared to those in another.
Because the ELF contains many sensitive variables on individuals’ labor market outcomes, we are unable to share the raw data and have to restrict ourselves to disseminating aggregated results in accordance with Eurostat’s anonymization criteria.
To supplement the ELF, we used additional data drawn from various EU agencies:
– Wages: The ELF only contains income deciles (up to 2020), i.e., it does not include the actual Euro value people are earning. We matched these deciles to annual earnings data derived from the Structures of Earnings Survey (SES), which Eurostat compiled for us. The SES dataset we received from Eurostat is accessible here.
– Regulated professions: We scraped the Regulated Professions Database directly from the website and manually matched individual professions to ISCO 2008 occupations contained in the ELF.
– Shortage occupations: We extracted the shortage occupations contained in the EURES “Report on labour shortages and surpluses”, which operates on the ISCO 2008 4-digit level. Each 3-digit occupation contained in the ELF is marked as ‘shortage’ if it contains a 4 digit occupation mentioned in the EURES report for a given country.
– GDP: We used a custom Eurostat table to derive annual GDP estimates by country. You can find the table here.
Limitations
We want to be transparent about the limitations of our data analysis. First and foremost, Germany, the EU’s biggest economy, is missing from our analysis. We hope to add it later on when the country’s statistical agency grants us access.
Our analysis is based on sensitive microdata, so we cannot share the raw data due to European privacy rules. We also abided by Eurostat’s anonymization rules, which means that we cannot analyze fewer than 50 respondents at a time, which explains some of the blank fields in the table. If you want to follow every step of our analysis, feel free to check out our Github repository.
Finally, the ELFS is a cross-sectional survey: Every respondent only answers the survey a single time and we cannot track their development over time. This setup makes it difficult to determine causation. For example, do language courses really cause worse labor market outcomes in many countries or are people who find it difficult to get good jobs more likely to seek out language training? Unfortunately, cross-sectional data is unavailable to answer such questions.
If you have further questions about the data, analysis, reporting process or are interested in collaborating with Lighthouse Reports, feel free to reach out to us at eva ‘at’ lighthouserports ‘dot’ com and justin-casimir ‘at’ lighthousereports ‘dot’ com.
About Lighthouse Reports
Lighthouse Reports pioneers collaborative journalism and works with the world’s leading media to deliver deeply reported, public interest investigations.
About Big Local News
From its base at Stanford University, Big Local News gathers data, builds tools and collaborates with reporters to produce journalism that makes an impact. Its website at biglocalnews.org offers a free archiving service for journalists to store and share data.
Learn more by visiting our About page.
The story recipe and data on brain waste is completely a project of Lighthouse Reports. Any questions about this project should go to Lighthouse Reports. If you have data or a project you would like to share using the Big Local News platform, please reach out to us [email protected].


