Big Local News helps tracking students during the pandemic
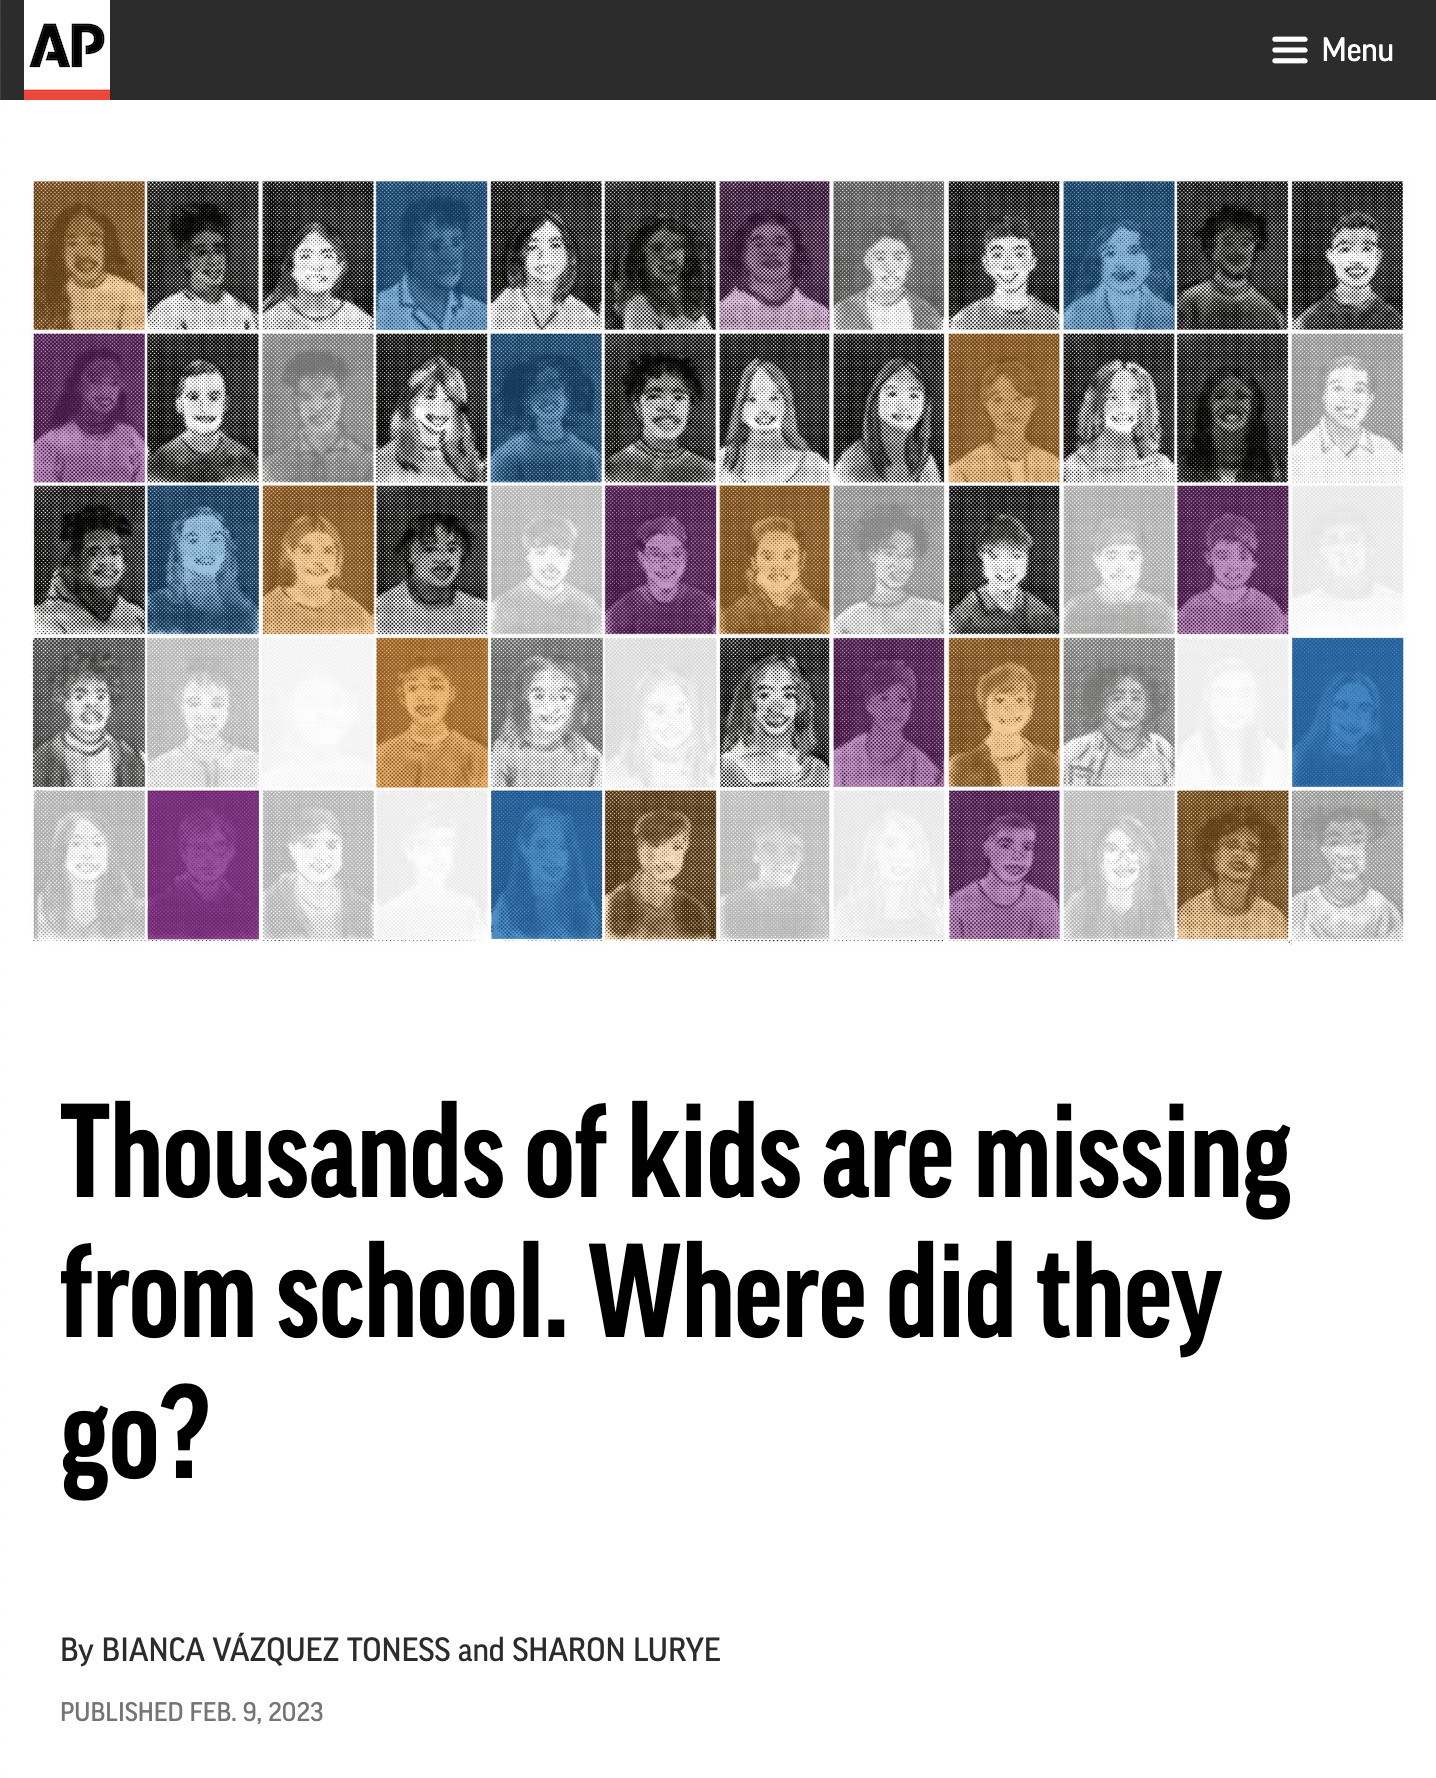
During the pandemic, K-12 public schools saw a dramatic drop in enrollment. Experts say there are over one million fewer students attending public schools. This decline was especially evident for kindergarteners.
Where did these kids go?
To answer that question, Big Local News teamed up with The Associated Press and Stanford University’s Graduate School of Education. We collected data at the state level for all public schools, private schools in 35 states and homeschooling in 33 states.
The enrollment data covers three school years from fall 2019 to fall 2022. We also provide Census estimates for the school-age population in each state during this same period.
We found that much of the decline can be attributed to growth in homeschool and private-school enrollment. The analysis shows that in the 21 states plus D.C. with available data, homeschool enrollment grew by 30 percent and private-school enrollment by 4 percent. Taken together, the increase in nonpublic enrollment explains about 40 percent of the public-school enrollment loss, in these states.

Next, we looked at the school-age population. The analysis shows that population declines could explain another 26 percent of the overall K-12 public school drop in enrollment.
That leaves about a third of the public-school decline unexplained. More kids left the system than could be accounted for by a shrinking population or by increases at private schools and homeschools. In total, about 230,000 students could not be accounted for in the 21 states and D.C. California alone had over 150,000, and New York had nearly 60,000.
These are “missing” kids – at least missing from the data. In reality, these students may be unregistered homeschoolers, truant/unschooled or their families simply decided to skip kindergarten. In fact, the analysis shows these unexplained declines tended to be in states where kindergarten is not required.
Getting the data
All cleaned and processed data files have been made available on Stanford’s Digital Repository.
Reporters can download a spreadsheet with state-level summary data used for the story. We calculated the “residual,” in 21 states and D.C. where adequate data was provided. In theory, the residual should be close to zero.
Local reporters can gather data for their own region and calculate the residual fairly easily using the following formula:
Change in public enrollment +
Change in private enrollment +
Change in homeschool enrollment -
Change in school-age population
In states where there are no (or few) missing kids, reporters can still look at how school enrollment has changed during the pandemic in their area, especially private schools and homeschools.
More detailed data is available as CSV files showing public-school enrollment by state, grade and year; private-school enrollment by state, grade and year; and annual school-aged population estimates by state and age. Unfortunately, in most states, homeschool data by grade does not exist.
For reporters who really want to dig in, we created an open project on the Big Local News platform with all the raw data on private schools and homeschools. If you don’t have a login, sign up for a free account here.
If you have questions about the enrollment data, please reach out to [email protected].


