A beginner’s guide to FBI crime statistics
This post offers a brief overview of how to acquire and intepret America’s most common, nationwide source for crime statistics: the Federal Bureau of Investigation’s Uniform Crime Reporting Program. It was prepared for an April 2022 training of reporters who work for California public media.
What are UCR crime reports?
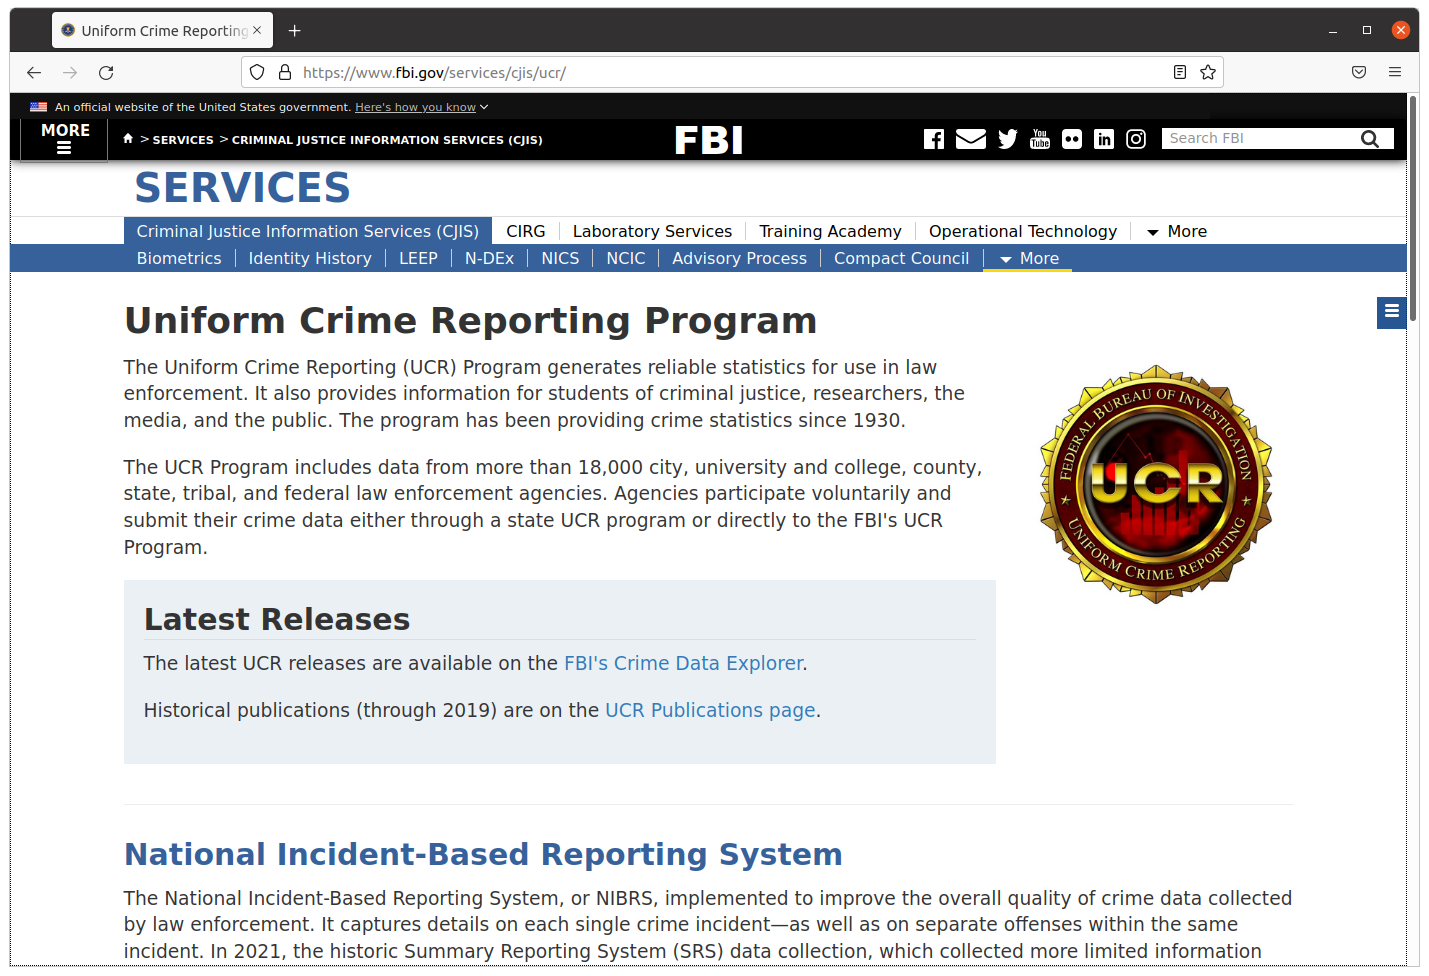
Started in 1930, The FBI’s Uniform Crime Reporting Program — often referred to as UCR — aims to publish reliable figures tracking crime nationwide. It does so by gathering a consistent set of statistics from the more than 18,000 local law enforcement agencies that police the United States.
Each year, the crimes logged by local police departments, which can vary in terminology and definition from state to state, are funneled into one-size-fit-all federal categories. Those numbers are consolidated by the FBI and published in an annual compendium called “Crime in the United States.”
The FBI database only tracks what the bureau calls major crimes, also known as Part I crimes. The list is comprised of four violent crimes and four property crimes.
Violent crimes
- Murder
- Rape
- Robbery
- Aggravated assaut
Property crimes
- Burglary
- Larceny-theft
- Motor vehicle theft
- Arson
The FBI does not collect reports of other crimes like drug offenses, financial crimes, domestic violence, most sex crimes and alcohol-related charges like drunk driving. These are known as Part II crimes. Only arrests are tracked at the national level.
While far from comprehensive, UCR statistics are the mostly frequently cited source by politicians, police leaders and the media. If someone in your city is talking about the crime rate, they probably got their numbers from the UCR.
Where you can get the data
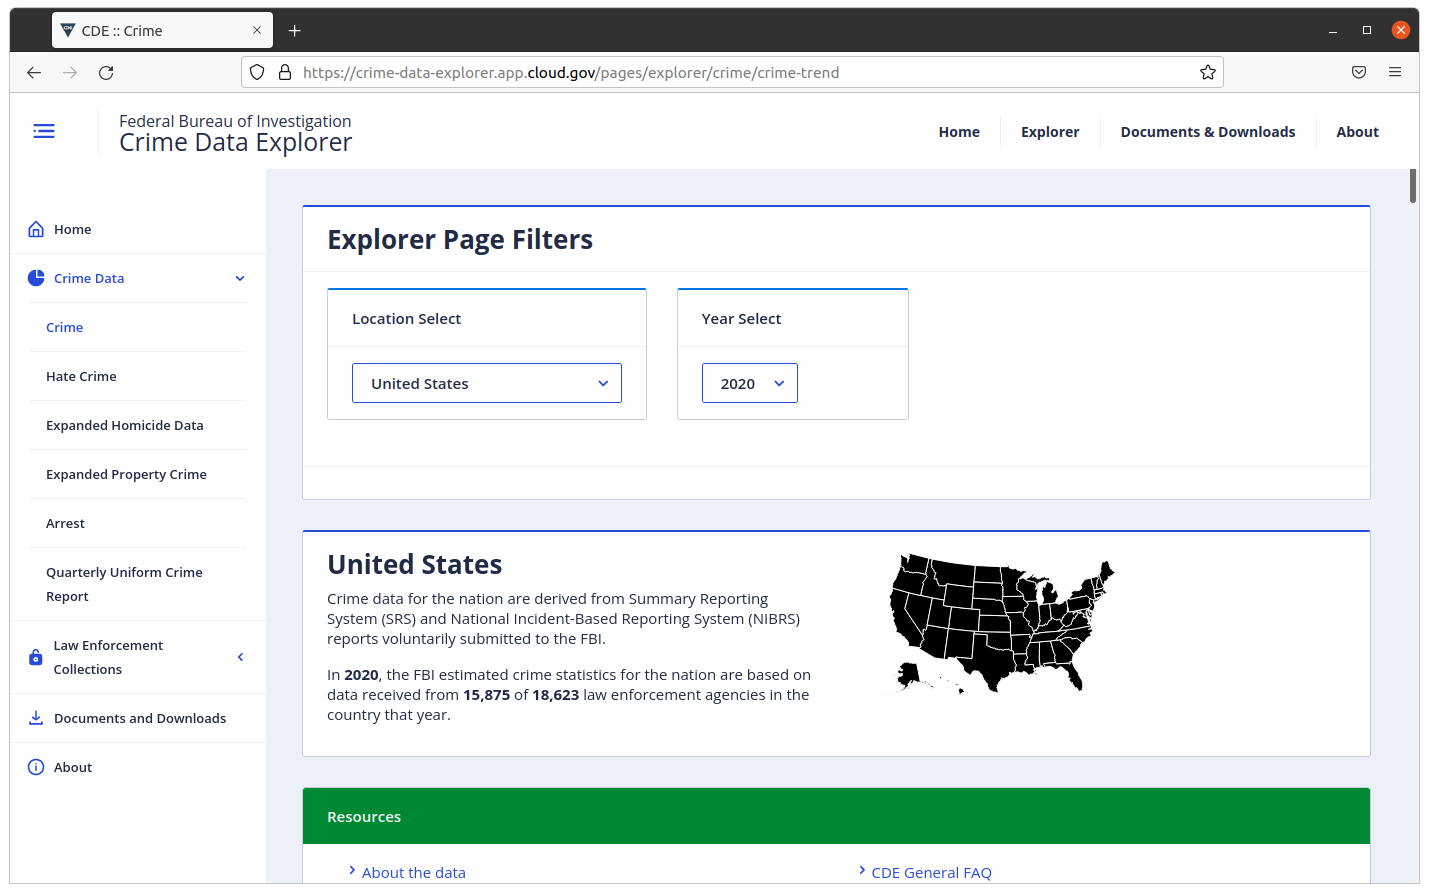
The FBI website publishes annual totals for each local law enforcement agency going back to 1985. The easiest way to find figures is the bureau’s Crime Data Explorer. It lets you quickly see trends in any area.
However, because the FBI site only updates once per year, the tallies often lag behind public discourse. Many local law enforcement agencies publicize the statistics they send the FBI on a much more frequent basis. For instance, as of this writing, the most recent totals in the FBI Data Explorer are for calendar year 2020, which ended 16 months ago. Meanwhile, the Los Angeles Police Department offers a citywide snapshot each week that is rarely more than a few days old.
The result is that discussion of recent trends in crime in a given city is typically driven by a local law enforcement agency’s latest disclosure, and often lacks the broader context that comparisons with other areas can provide. Covering the story in this common circumstance requires journalists to provide perspective by contrasting the numbers published on a city data portal or police website against the UCR database and other sources.
Additionally, the FBI is currently in the midst of a long, costly change to the underlying technology that gathers UCR data. Many local law enforcement agencies, including some of the largest in California, have yet to adopt the new system, which is known as NIBRS. After years of running the old and new systems in tandem, the agency is set to stop gathering data from areas that have failed to upgrade.
“Obviously this doesn’t mean crime data disappeared. You can still get summary-level California [numbers] or New York’s data from the state, or from each agency,” said Weihua Li, a reporter specializing in criminal justice data at The Marshall Project. “But it will be tough to capture the national picture, or to compare states.”
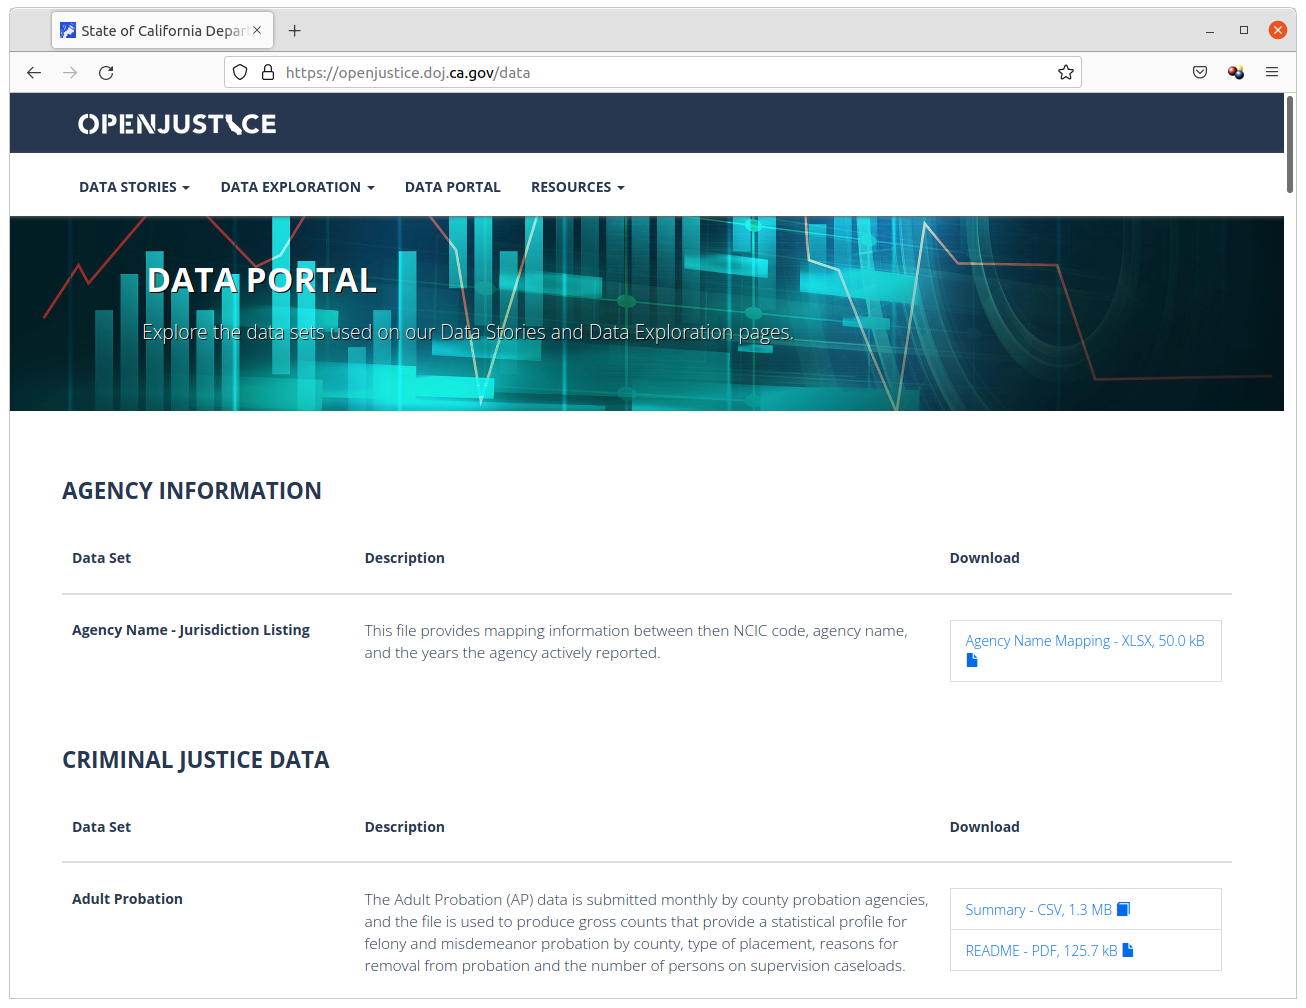
If you’re covering crime in California, you have another data source available. The state Attorney General publishes a data portal that includes a spreadsheet of the UCR tallies for all law enforcement agencies in the state. It’s the same data you can get from the FBI, but easier to download and maniuplate in a spreadsheet.
Common comparisons
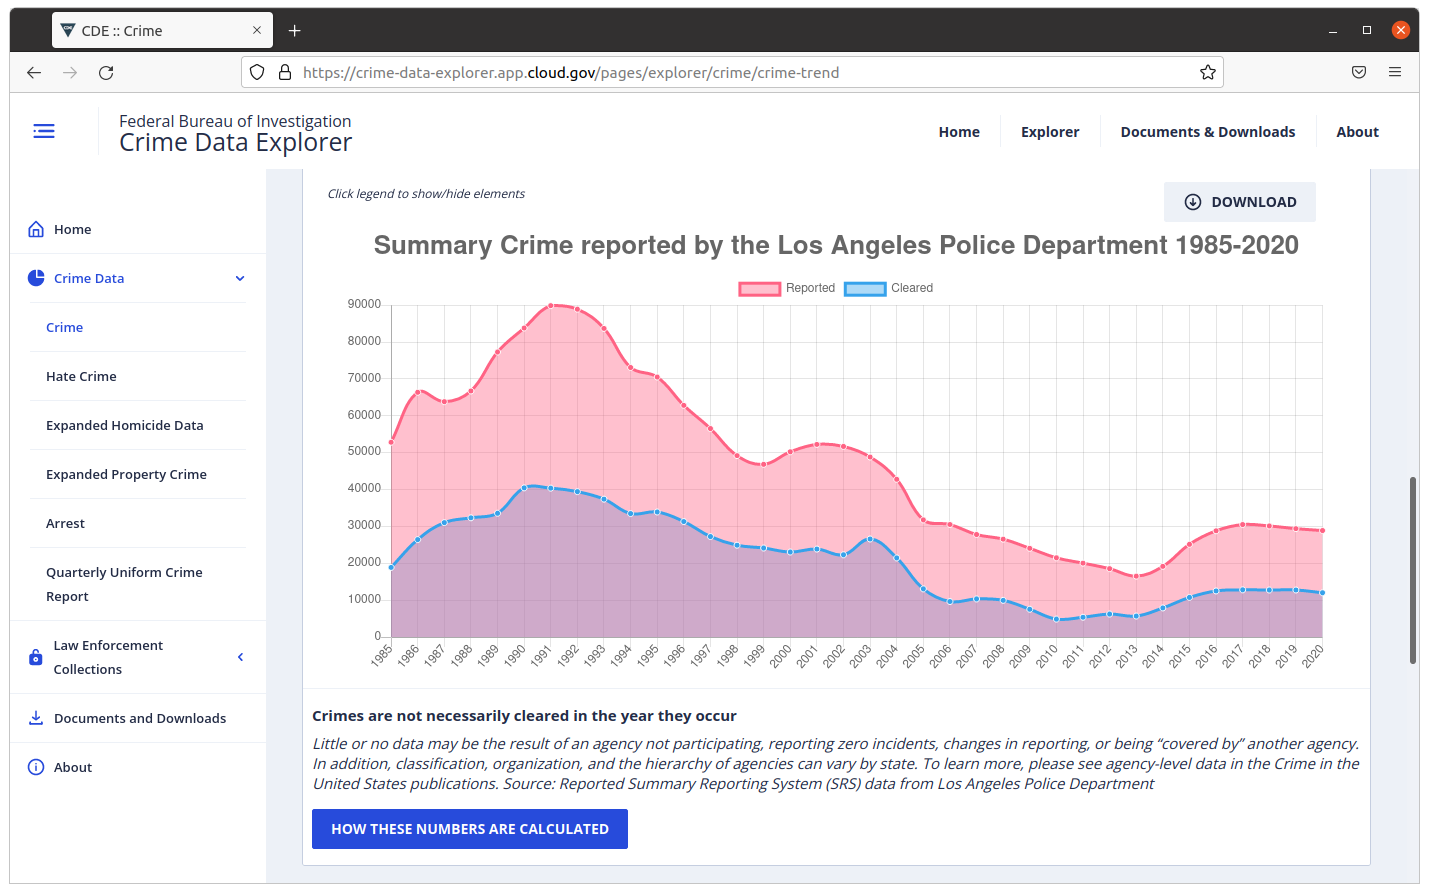
One comparison you should always consider is looking at the numbers over time. By and large, America’s crime counts peaked in the 1980’s and 1990’s, followed by a long period of decline. While today’s tallies may show an increase over last year, they could still be far below what was registered in the not-so-distant past. This comparison can be accomplished by creating a consolidated dataset that combines past UCR totals for your local law enforcement agency with the latest figures published by police. Take them together and you’re ready to chart crime over time in your area.
Another textbook maneuver is to compare the latest crime rates in your area against other cities. Are trends in your city unique, or part of a larger national story? Should your local policymakers get blame or credit for changes in crime? You can start to answer these questions by comparing your local results against other areas. Because the FBI’s consolidated dataset updates so slowly, this often requires reporting out the latest data in the areas you’d like to compare. It’s a burdensome task and why so little local crime coverage provides this kind of context. You can distinguish your story by doing the homework.
Comparing figures between different cities often requires adjusting for differing populations by calculating the rate of crime per resident. This is a common way of leveling the playing field. A per capita rate is the most common technique.
Caveats to consider
As always, it’s crucial for journalists to keep caveats in mind to avoid reading the wrong thing into numbers. There are several common challenges to interpreting the UCR.
If multiple crimes are linked to a single event only the most serious offense is counted. This can lead to UCR totals coming in slightly lower than other totals generated by police departments, which may sometimes tally all unique offenses. For instance, if an aggravated assault and a grand theft auto occur as part of the same incident the aggravated assult is included in UCR totals while the grand theft auto is left out. Arson is the exception to this rule; All occurances are tallied in all cases.
When filing their local crime reports into the eight federal categories, departments can make different decisions about which crime to file where. Differences are sometimes intentional and other times accidental. The result is that, in rare cases, tallies from certain cities cannot be compared against others. In the past, one notable example of this was the city of New Orleans, which failed to report many rapes, leading to abnormally low totals.
Also, definitions of crimes can change over time, introducing noise to the UCR dataset. For instance, in 2013 the FBI modified its definition of rape, which resulted in a shift in counts all across America. For that reason, trends in rape must be interpreted much more carefully than other crimes.
As with any other source, if you see something unusual, you should tred carefully, ask questions and consult experts.


